
Customers kept getting stuck in the same places. I asked why they had to.
New customers would connect an integration, then stall at the part that made the product useful. Support could explain it, one ticket at a time. So I proposed guided onboarding inside the product.
customers completed the guided onboarding that came out of it
Order Desk · the company's firstThese moved while I worked on onboarding, activation and retention. I contributed to them. I didn't cause them alone, and plenty else moves numbers like these.
Trial-to-paid conversion
Lower average churn
Lower churn on the Pro plan
What would you order?
Everyone has an answer, and it says more about them than they expect. So I built a place to put it: type any dishes, choose where you'd eat them, and see your last meal served. Then send it to someone who now has to answer too.


The whole product is one loop. Everything else had to earn its place around it.
First week · counts, not rates- i
Discover
Someone lands on the site.
106 visited - ii
Build
One box. Type anything, from steak to “Nan's roast”.
26 opened the builder15 added a dish - iii
Serve
The reveal: your meal, plated, with a menu and a bill.
9 meals served - iv
Share
It asks the next person the same question.
8 shares - v
They build
The step that decides whether this works. I don't have enough evidence yet to judge it.
too early to call
What the first week saysThe biggest drop happens before the product begins. 106 visited. 26 opened the builder. Of the 15 people who added a first dish, 9 reached a served meal. So the next question isn't how to make the builder easier. It's why people arrive and don't start.
I built payments before I'd proved anyone wanted the product. So I took them out.
Paid tables were working code a day after the database was. Then I got close to launch and realised I was about to charge people for a loop I hadn't seen happen once.
Visit Last Meals ↗ Designed, built and shipped independentlyShipped
What I didn't ship
Paying came before proof.
Good idea. Unreliable. Not the loop.
It isn't a social network.
Churn, Before It Happens: can you spot churn before someone decides to leave?
Isn't necessarily true.
I explored the score, then questioned whether one number was actually more useful than plain risk flags. One number is easier to sort by. It's also easier to believe than it deserves.
The dashboard wasn't the hypothesis. The signals were.
So the first thing to test isn't software. First I'd need to know whether the signals actually meant anything.
Where it ended up: researched and developed into a working product concept. It wasn't prioritised for implementation, so none of these signals were ever validated.
See the thinking →Trial
Are they getting to value?
Activation problem.
Help them reach value.
Paying
Are they continuing to get value?
Retention problem.
Find out what changed.
Looks precise.
Isn't necessarily true.
What does 42 mean if you haven't proved the weighting?
I explored the score, then questioned whether one number was actually more useful than plain risk flags. One number is easier to sort by. It's also easier to believe than it deserves.
The dashboard wasn't the hypothesis. The signals were.
So the first thing to test isn't software. First I'd need to know whether the signals actually meant anything.
Look back
Move backwards from known outcomes. Did these behaviours actually differ between customers who stayed and customers who left?
Shadow run
Move forwards. Flag customers, contact nobody, and measure whether the signals predict anything, including false positives and how much warning they actually give.
Intervene
Only after that, split the path. Test an intervention against an appropriate comparison group.
Where it ended up: researched and developed into a working product concept. It wasn't prioritised for implementation, so none of these signals were ever validated.
See the thinking →The question
When did I last…?
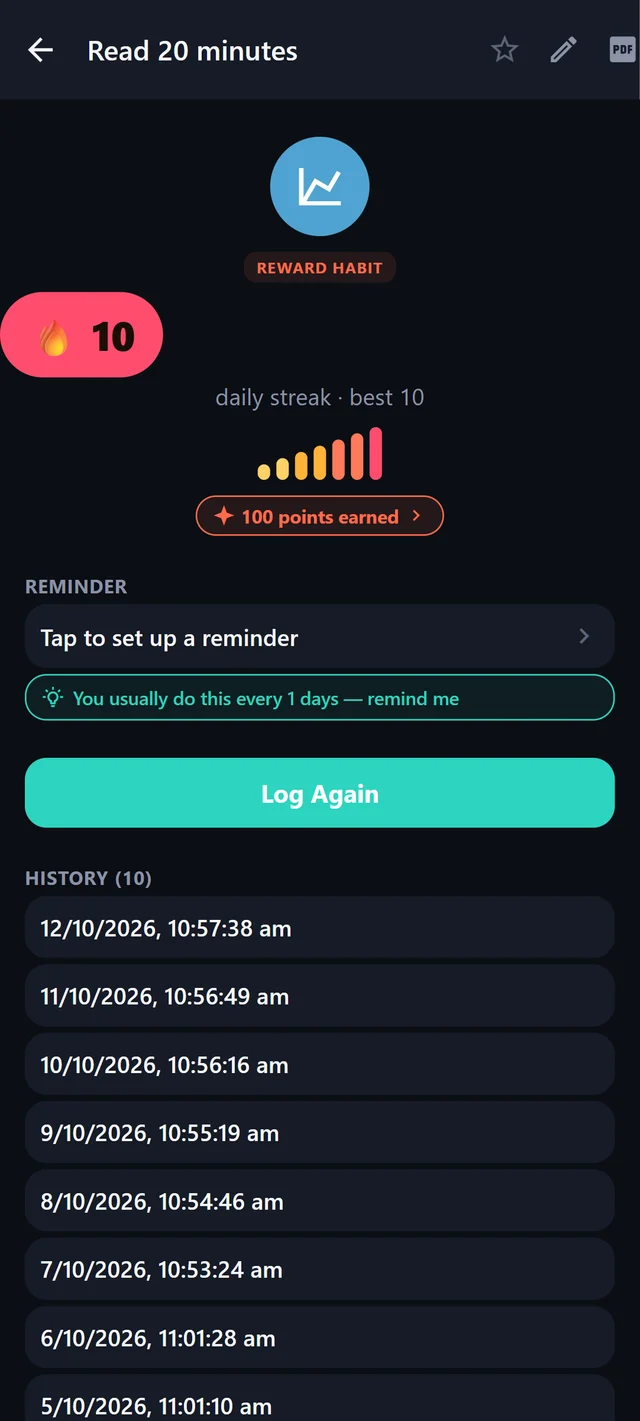
TimeSince answers one question and asks for nothing back. Log the haircut, the gym, the call to your mum. Later it tells you how long it's been. No streaks to break, no targets to miss.
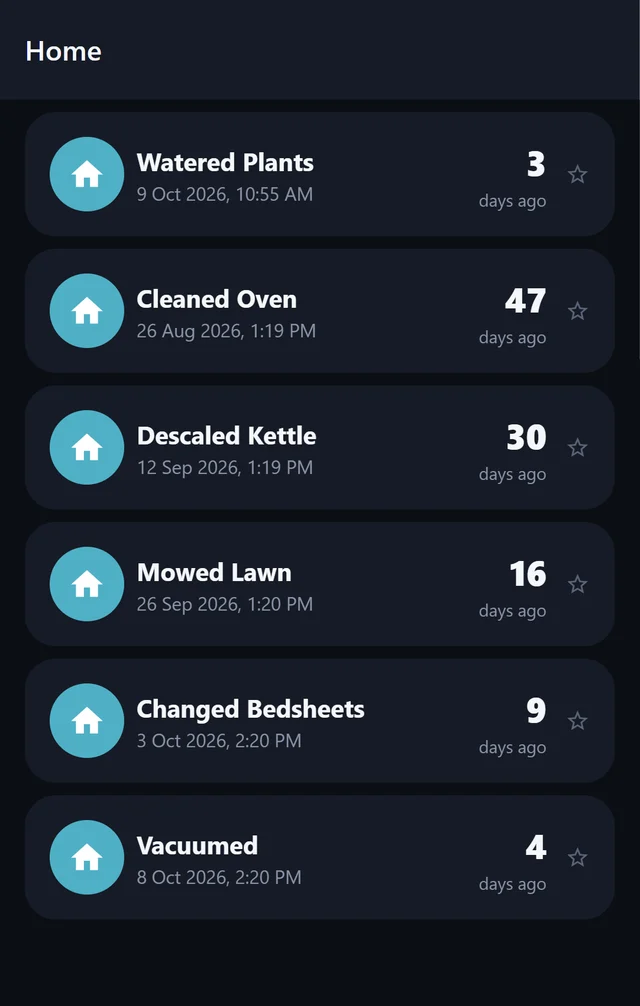
1 July 2026
TimeSince existed first.
A native app whose whole point was the absence of pressure.
13 July · the idea leaves the app
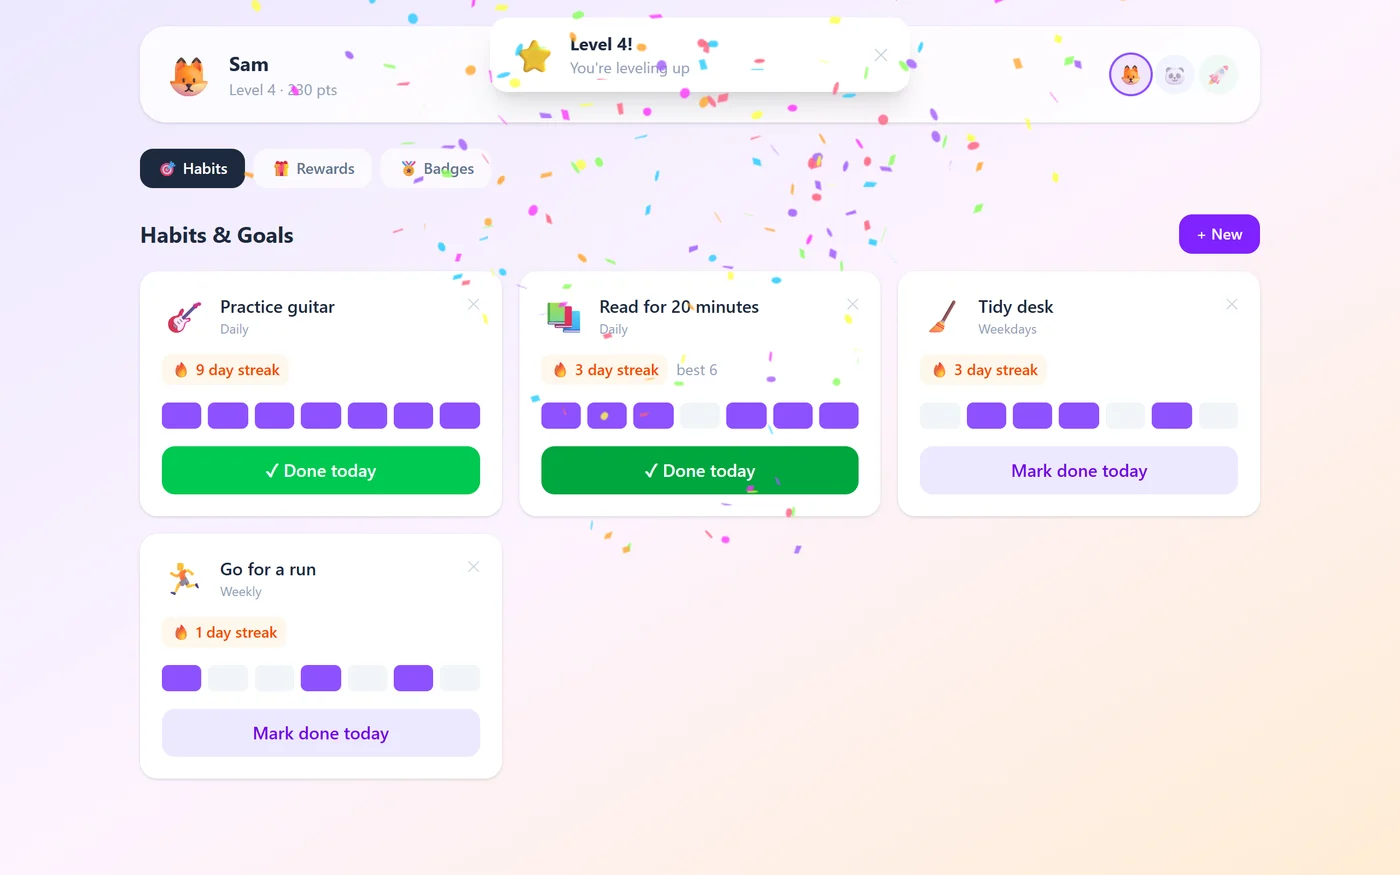
I had a reward idea I wasn't sure about.
Points, levels, badges, a shop where points buy real rewards. Built for ADHD brains. It might help a habit stick. It might also wreck the calm. So I built it somewhere it couldn't hurt: a separate web app.
25 July · selected ideas come back
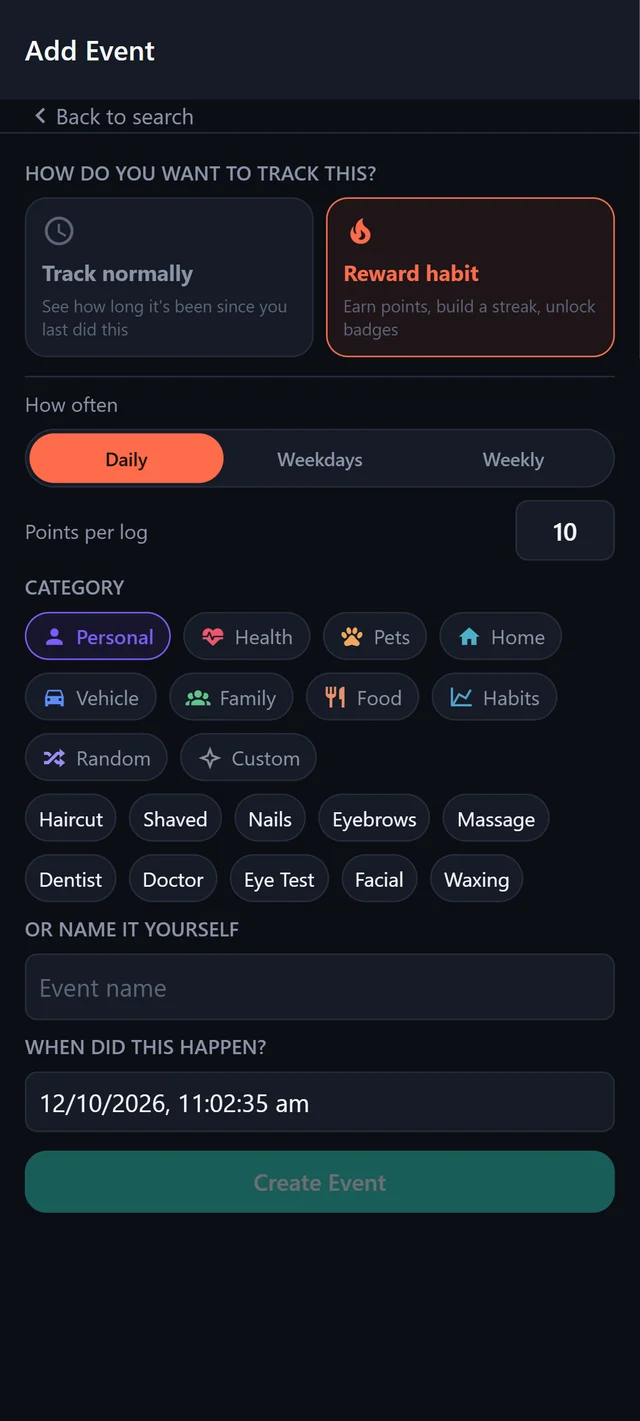
Off by default. One thing at a time.
Each thing you track now chooses: Track normally or Reward habit. And one fix on the way in: in the prototype, spending points could drop your level. In TimeSince it can't.
TimeSince removed pressure. Rewards risked putting it back.
A feature can work perfectly and still make the product less clear.
The prototype clarified the mechanics, not whether the whole reward system belonged in TimeSince. I brought back optional reward habits and separated lifetime progression from spendable points. The larger game layer stayed behind.
I don't have reliable usage data showing meaningful retention or adoption, so I wouldn't treat installs or informal testing as validation. Motivation Quest was a web prototype and is no longer live. Screens are from the current builds, running with sample data.
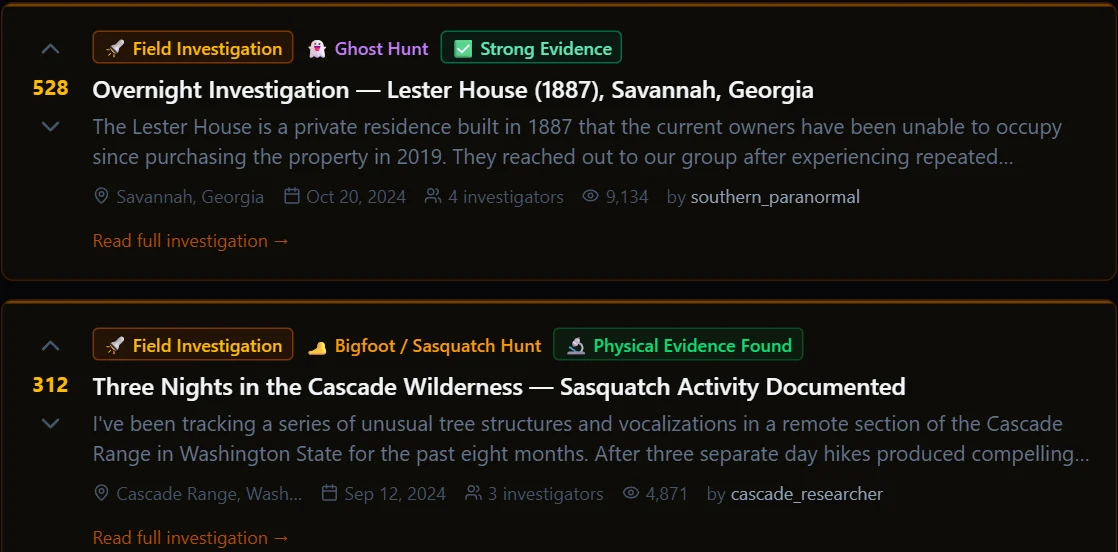
Designed and built independentlyUFOs, cryptids, hauntings. And a trust problem.
How do you build a community around extraordinary claims without treating every claim as equally credible?
Exhibit A sample investigation I wrote and seeded to show the format. Not a real user's report.
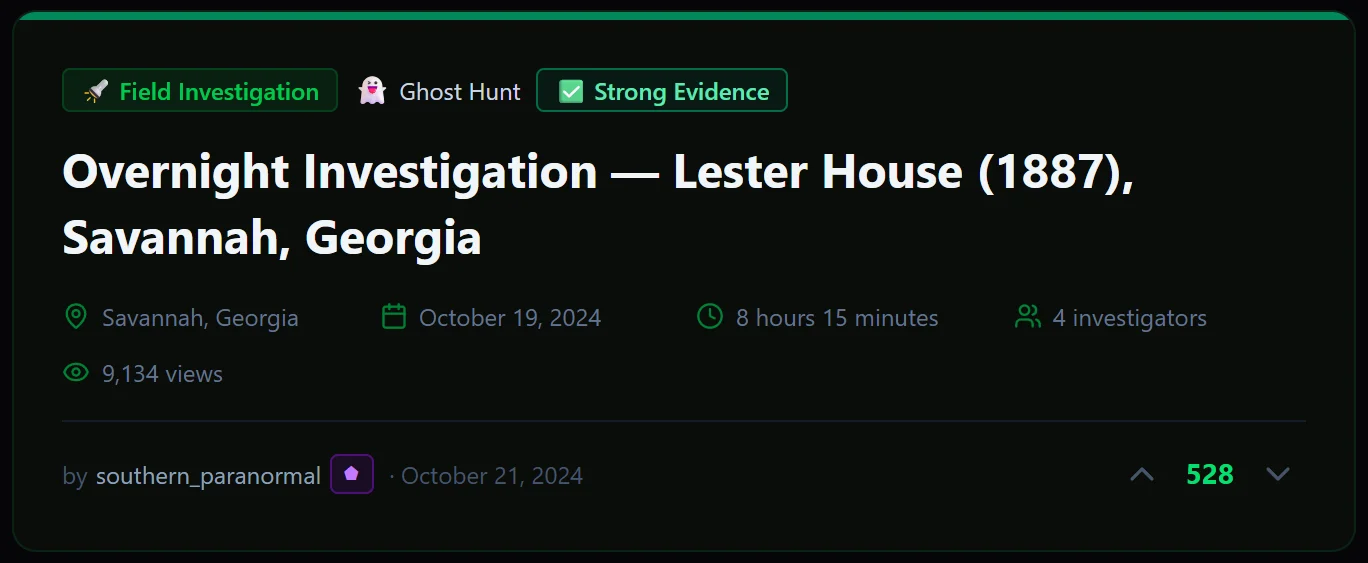
- What kind of claim is this?Sighting reports, field investigations and fiction are separate types. A ghost story and a logged investigation never sit in the same pile.
- Who's saying it?The small badge beside the name is a credibility level, from a score built on what they've done on the site. More on that score below.
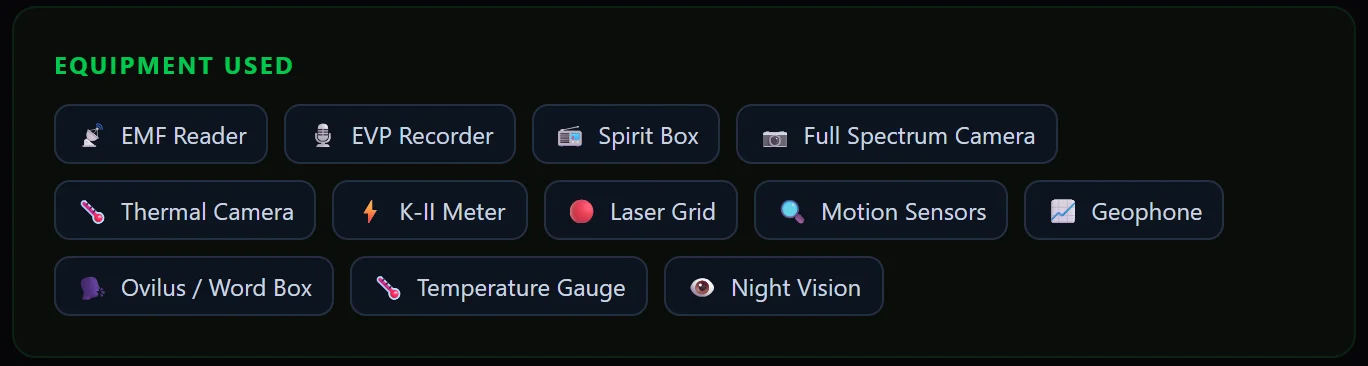
- How did they look?An investigation records its method: equipment, duration, how many people. Enough for someone else to disagree with something specific.

- What did it amount to?Five possible outcomes, from Nothing Found to Strong Evidence. “We found nothing” is a valid report.
The first credibility model
I built a reputation score. Then I noticed the assumption inside it.
The early model awarded 5 points for each report filed, 2 for each vote received and 10 for each corroboration. It rewarded contribution and corroboration.
In hindsight, activity isn't the same thing as credibility. A prolific reporter isn't necessarily a reliable one. Before treating this score as meaningful, I'd need to test what actually predicts trustworthy contributions.
- ○Unverified0
- ◎Reported10
- ◉Corroborated50
- ★High Interest150
- ⬟Investigator400
The cold start
I seeded the first reports and investigations because an empty community can't demonstrate its own behaviour. That solved the presentation problem, not the network problem. Seeded content isn't traction, and I don't count it as traction.
The question
What did you actually make?
You bought a card for $75. Its market value is $240 now. Easy: you're up $165. Hoard exists because that number is wrong, and most collectors never find out by how much.
Profit on one graded card
$73.50
Your actual profit
- Current market value$240.00minus the $75.00 you paid
- Grading−$45.00the fee to get it slabbed
- Grading shipping−$12.00there and back
- Supplies−$3.00sleeves, top-loaders
- Selling fees−$31.50if you sold it on eBay today
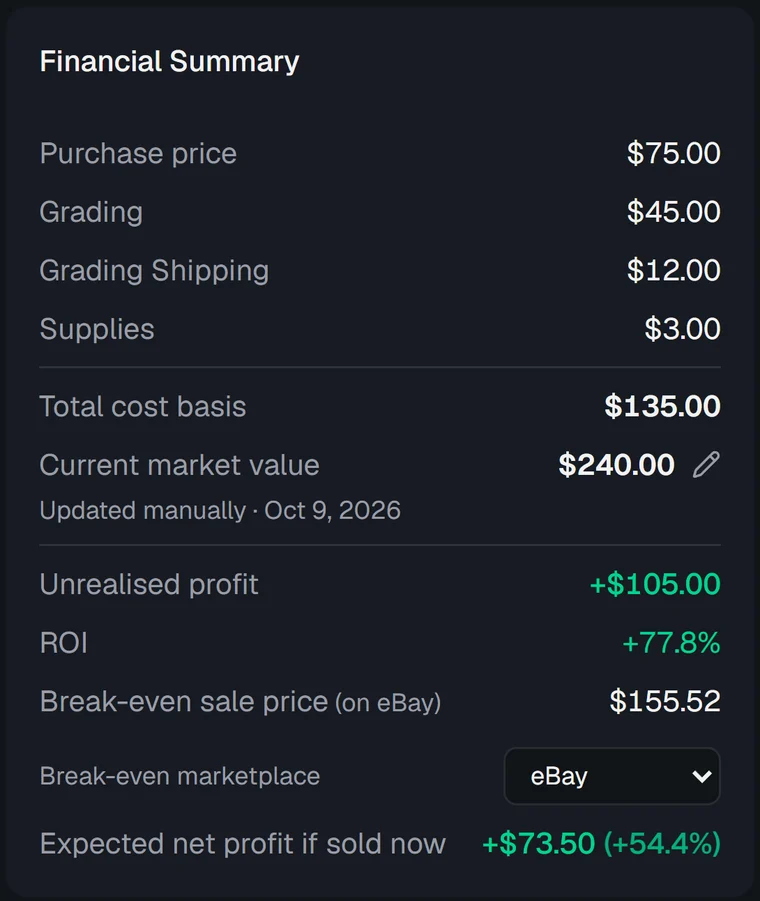
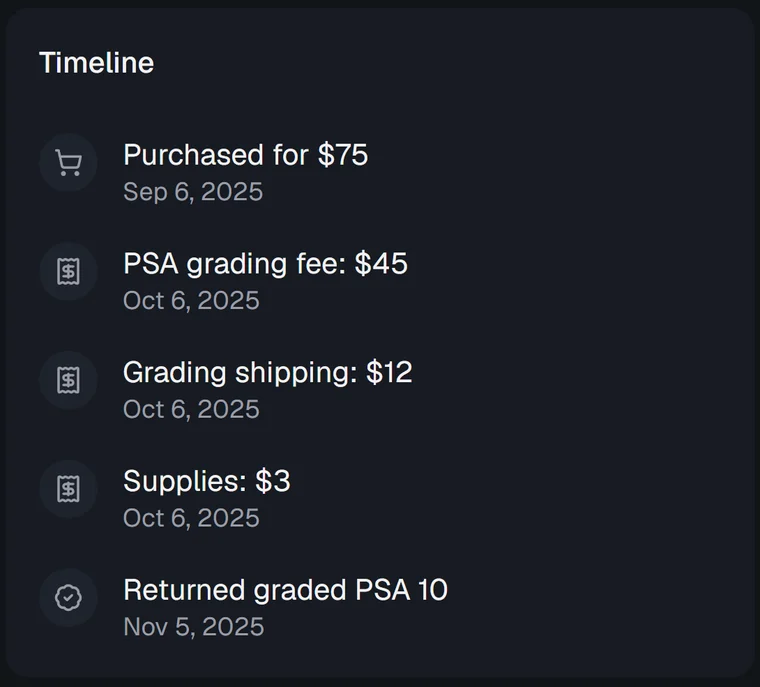
Hoard's own screens for this card
One card is the easy case.
Then you buy a $500 binder and only a couple of cards in it are worth cataloguing. Or you trade a card plus $20 cash for a different card. Or you sell part of what you bought. Each of those quietly changes what everything else cost you.
Hoard is a prototype and isn't publicly live. Figures are from the app's built-in demo collection, not a real portfolio. $240 is a market-value estimate, and selling fees are the difference between two of the app's own numbers.
Designed and built independentlyAbout
I don't need every idea to work. I need it to teach me something.
I'm Matt Thompson. I started in technical support at a SaaS company and stayed six years. For most of that time my job was hearing, first-hand, where people got stuck, what they misunderstood, and which problems kept coming back.
Answering one customer well doesn't fix the thing that confused them. So the work shifted: find the friction that repeats, and fix it in the product or the journey instead of in the inbox. That became my role as Customer Experience Strategist, working on onboarding, activation and retention.
Then I started building the fixes myself. Some of what's above started as a serious product question. Some of it started because I thought it would be fun.

Looking for roles in product management, growth, strategy and operations. Based in New Zealand, working remotely.